
Android 16 vs Android 17

Updated: Aug 17
Real-World Performance Benchmarks on the Google Pixel 8a with SmartViser's viSer Neo
With every new Android release, Google introduces new capabilities designed to improve security, intelligence, connectivity, and the overall user experience. While feature announcements often attract the headlines, mobile operators, device manufacturers and test laboratories need to answer a more important question:
Do these updates deliver measurable improvements in real-world performance?
To answer this question, SmartViser used its viSer Neo active test automation platform. Following the release of Android 17, we benchmarked the Google Pixel 8a running Android 16 and Android 17 under identical test conditions to evaluate the impact of the new operating system on everyday mobile usage.
Our benchmark evaluated key aspects of smartphone performance across the mobile experiences that matter most to users, including network performance, web browsing, messaging, multimedia streaming and gaming performance.
Consistent Testing for Reliable Results
To ensure a fair comparison, both test campaigns were executed using the same Google Pixel 8a device, identical SIM configuration and the same automated test sequence.
The benchmark was performed under controlled conditions using SmartViser's viSer Neo test automation, eliminating human variability and ensuring repeatable results. Throughout the tests, viSer Neo continuously collected application performance metrics alongside detailed radio measurements, allowing user experience to be correlated with actual network conditions.
What's New in Android 17?
Android 17 builds on the solid foundation established by Android 16, introducing further improvements in performance, connectivity and AI-powered capabilities.
Feature | Android 16 | Android 17 |
|---|---|---|
AI Integration | Expanded Gemini integration | Enhanced on-device AI and smarter contextual assistance |
Performance | Improved background task management | Further system optimisation and faster resource scheduling |
Connectivity | Enhanced 5G support | Improved modem efficiency and connectivity management |
Privacy & Security | Advanced privacy sandbox features | Additional privacy controls and stronger security protections |
Battery Management | Adaptive battery improvements | More intelligent power optimisation |
User Experience | Refined interface and animations | Smoother system responsiveness and UI refinements |
Future Connectivity | Initial NTN enhancements | Expanded support for emerging technologies, including NTN |
While many of these enhancements operate behind the scenes, they have the potential to influence network responsiveness, application performance and overall user experience.
Test Environment Validation
Before analysing application performance, viSer Neo verified that both benchmark campaigns were executed under comparable conditions, including volume and brightness.

Radio Environment Analysis
One of the key strengths of SmartViser's viSer Neo is its ability to continuously monitor radio conditions throughout an automated benchmark. This enables engineers to correlate application performance with the quality of the mobile network experienced during testing.
For this benchmark, the primary radio indicators analysed were Reference Signal Received Power (RSRP), which reflects signal strength, and Reference Signal Received Quality (RSRQ), which measures signal quality and interference.
RSRQ (Signal Quality)
RSRQ is a key indicator of LTE radio quality. Better (less negative) values indicate lower interference and generally allow the network scheduler to allocate radio resources more efficiently.

The benchmark shows that Android 17 spent considerably more time operating under excellent radio quality conditions.
The percentage of measurements within the best RSRQ range (-8 to -3 dB) increased from 41.6% on Android 16 to 60% on Android 17, representing a substantial improvement in overall signal quality.
Although Android 17 also recorded a small increase in the proportion of measurements within the poorest category, these represented only 5.1% of the total benchmark and had a
limited impact on the overall results.
Overall, the RSRQ distribution indicates that Android 17 experienced a cleaner radio environment with lower interference during much of the benchmark. This is consistent with the higher download throughput and lower latency measured during testing.
RSRP (Signal Strength)
RSRP measures the received LTE signal strength.
Unlike RSRQ, stronger signal strength alone does not necessarily translate into higher throughput, but it provides useful context for interpreting network performance.

The RSRP results indicate that Android 17 generally operated with slightly weaker received signal strength than Android 16.
While Android 16 spent most of the benchmark in the stronger -100 to -91 dBm range, Android 17 recorded a higher proportion of measurements in the -110 to -101 dBm range.
Interestingly, despite the weaker received signal strength, Android 17 still achieved a very good performance.
This highlights an important principle in mobile network performance: signal quality is often more important than signal strength.
The improved RSRQ distribution observed during the Android 17 benchmark indicates lower interference and more efficient utilisation of the radio channel, enabling better overall network performance despite the slightly lower signal strength.
Web Browsing Performance
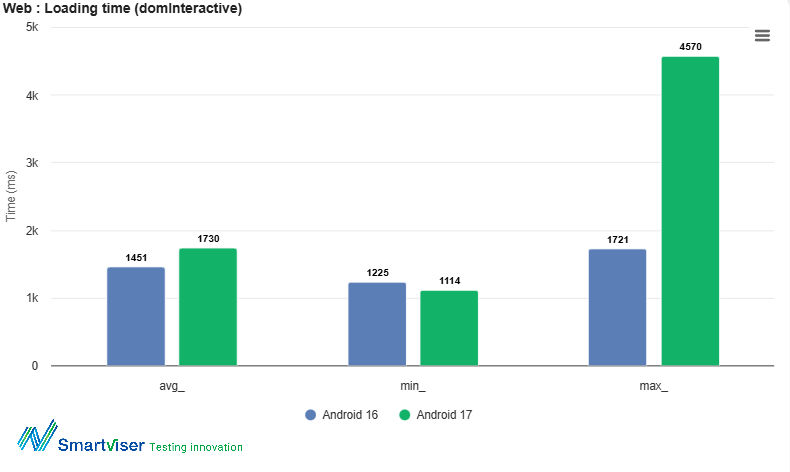
To evaluate web browsing performance, SmartViser's viSer Neo measured the loading time, which represents the point at which a webpage becomes responsive to user interaction. This metric closely reflects the perceived responsiveness experienced by users during everyday web browsing.
The benchmark results show mixed performance between Android 16 and Android 17.
KPI | Android 16 | Android 17 |
Average Loading Time | 1,451 ms | 1,730 ms |
Minimum Loading Time | 1,225 ms | 1,114 ms |
Maximum Loading Time | 1,721 ms | 4,570 ms |
Data Performance Speed Test: Download Throughput
One of the most significant improvements observed during the benchmark was in download throughput. Under identical automated test conditions, the Google Pixel 8a running Android 17 consistently achieved higher download speeds than when running Android 16.

KPI | Android 16 | Android 17 |
Average Download Speed | 104.37 Mbps | 140.14 Mbps |
Maximum Download Speed | 270.79 Mbps | 416.02 Mbps |
Data Performance Speed Test Upload Throughput
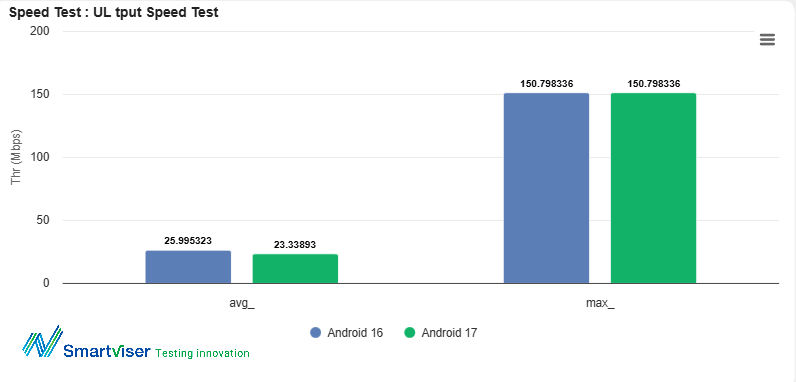
This chart below shows a different trend from the download throughput results. While Android 17 delivered a significant improvement in download performance, upload throughput remained largely unchanged, with a small reduction in the average upload speed.
KPI | Android 16 | Android 17 |
Average Upload Speed | 26.00 Mbps | 23.34 Mbps |
Maximum Upload Speed | 150.80 Mbps | 150.80 Mbps |
Ping RTT
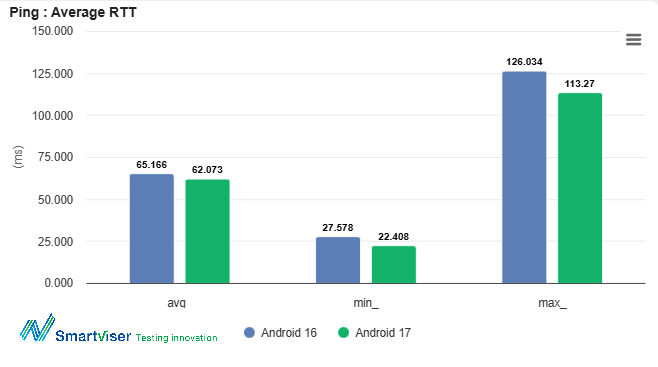
This is a good result for Android 17. Lower latency is one of the most important indicators of perceived network responsiveness, benefiting applications such as web browsing, cloud services, online gaming, video conferencing and messaging.
KPI | Android 16 | Android 17 |
Average RTT | 65.17 ms | 62.07 ms |
Minimum RTT | 27.58 ms | 22.41 ms |
Maximum RTT | 126.03 ms | 113.27 ms |
Why Lower Latency Matters
Latency has a direct impact on many everyday mobile applications:
Web browsing: Faster page requests and quicker interaction with websites.
Video conferencing: Reduced conversational delay and smoother communication.
Online gaming: Improved responsiveness and lower input lag.
Cloud applications: Faster synchronisation and file access.
Messaging services: Quicker message delivery and acknowledgements.
Although throughput often attracts the most attention, latency is frequently a better indicator of perceived user experience. The consistent reduction in RTT observed with Android 17 complements the significant increase in download throughput, demonstrating improvements in both speed and responsiveness.
SMS Performance
As part of this year's benchmark, SmartViser introduced SMS performance testing to evaluate the responsiveness of one of the most fundamental mobile network services. Although often overlooked in favour of data-centric applications, SMS continues to play a vital role in two-factor authentication (2FA), emergency alerts, enterprise messaging and IoT communications.

The benchmark measured the time required to send a Mobile Originated (MO) SMS message from the Google Pixel 8a under both Android 16 and Android 17.
The results show that Android 17 maintains excellent messaging performance, with a small but consistent improvement across all measured KPIs.
The average SMS sending time decreased from 1,379 ms to 1,362 ms, representing an improvement of approximately 1.2%. Similarly, the minimum transmission time improved by nearly 3%, while the maximum transmission time remained virtually unchanged.
KPI | Android 16 | Android 17 |
Average SMS Sending Time | 1,379 ms | 1,362 ms |
Minimum SMS Sending Time | 1,185 ms | 1,151 ms |
Maximum SMS Sending Time | 1,564 ms | 1,561 ms |
Gaming Performance
Graphics performance plays a critical role in the overall user experience, particularly for Mobile gaming. Maintaining a stable frame rate close to the display refresh rate ensures smoother gameplay, improved responsiveness and a more fluid visual experience.

KPI | Android 16 | Android 17 |
Average Frame Rate | 59 FPS | 59 FPS |
Minimum Frame Rate | 58 FPS | 58 FPS |
Maximum Frame Rate | 62 FPS | 60 FPS |
Both operating systems maintained an average frame rate of 59 FPS, with the minimum frame rate remaining stable at 58 FPS throughout the test. These results indicate that Android 17 preserves the smooth and consistent rendering performance required for modern mobile games and graphics-rich applications.
Although Android 16 recorded a slightly higher peak frame rate (62 FPS compared with 60 FPS), this difference is minimal and has no practical impact on the overall gaming experience. More importantly, the consistent average and minimum frame rates demonstrate that Android 17 maintains stable graphics performance without introducing frame drops or rendering instability.
Streaming Efficiency
To assess multimedia performance, SmartViser's viSer Neo measured YouTube streaming efficiency during automated video playback. This KPI evaluates how effectively video content is delivered and played without interruptions, making it an excellent indicator of the end-user streaming experience.
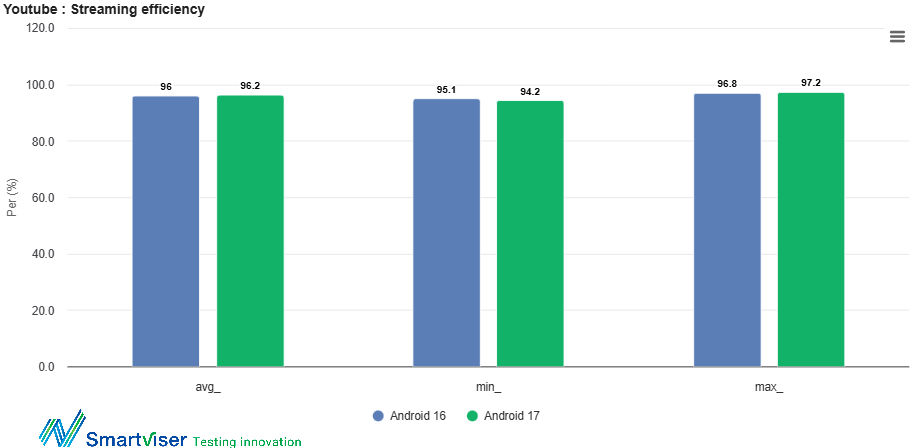
KPI | Android 16 | Android 17 |
Average Streaming Efficiency | 96.0% | 96.2% |
Minimum Streaming Efficiency | 95.1% | 94.2% |
Maximum Streaming Efficiency | 96.8% | 97.2% |
Battery Performance
Full Battery Endurance Benchmark
Battery life remains one of the most important indicators of smartphone performance. To evaluate the impact of Android 17 on power efficiency, SmartViser performed a full battery endurance benchmark using the Google Pixel 8a.
Unlike short-duration battery tests, this benchmark measured the complete battery discharge cycle. Both devices were fully charged to 100% before testing commenced and executed the same automated viSer Neo test campaign continuously until the battery was completely depleted and the device automatically powered off.
This battery benchmarking methodology provides an accurate representation of real-world battery endurance under sustained mixed usage.

KPI | Android 16 | Android 17 | Difference |
Battery Endurance | 10 h 31 min 57 s | 10 h 35 min 26 s | +3 min 29 s (+0.6%) |
Initial Battery Level | 100% | 100% | Identical |
End Condition | Device powered off | Device powered off | Identical |
Current Consumption by Application
To complement the battery endurance measurements, SmartViser also monitored the average current drawn during each application scenario executed by viSer Neo.
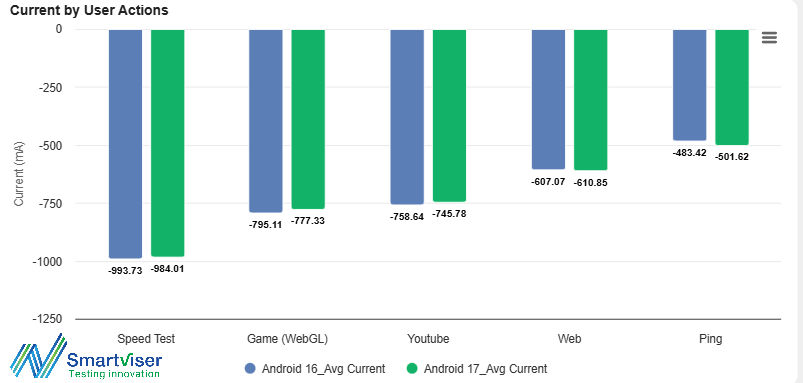
Average current consumption remained highly consistent between Android 16 and Android 17 across all application scenarios.
Several workloads actually required slightly less current under Android 17:
Speed Test: approximately 1% lower current consumption
WebGL Gaming: approximately 2% lower
YouTube Streaming: approximately 2% lower
These reductions suggest that Android 17 introduces modest improvements in system efficiency during more demanding multimedia and networking tasks.
Conversely, Web Browsing and Ping testing exhibited slightly higher current draw under Android 17. However, the differences are relatively small and had little impact on the overall battery endurance measured during the complete benchmark.
Overall, the current consumption profile confirms that Android 17 maintains an energy profile comparable to Android 16 while simultaneously delivering improved network performance.
Conclusion
The benchmark demonstrates that Android 17 represents a mature and efficient evolution of the Android platform.
Compared with Android 16, Android 17 delivers:
A higher average download throughput
Higher maximum download throughput
Lower network latency
Stable gaming performance
Excellent multimedia quality
Reliable SMS performance
Stable battery life
Perhaps the most significant finding is that these performance improvements are achieved without increasing power consumption or compromising battery endurance, highlighting the efficiency gains introduced by Android 17.
For mobile operators, device manufacturers and certification laboratories, the results confirm that Android 17 provides measurable improvements in user experience while maintaining the stability expected from a major operating system release.
Disclaimer: Testing was performed between 15th July and 30th of July 2026 on a live UK network. Results may vary depending on network, device, location and other environmental conditions.
About SmartViser viSer Neo

SmartViser's viSer Neo is a comprehensive active test automation solution designed to evaluate the real Quality of Experience (QoE) delivered by smartphones and mobile networks.
Supporting both Android and iOS devices, viSer Neo automates end-to-end testing of voice, messaging, web browsing, video streaming, gaming, battery performance and network connectivity while simultaneously collecting more than 100 network, radio and application KPIs.
By replacing manual testing with fully automated, repeatable workflows, viSer Neo enables mobile operators, device manufacturers, chipset vendors, regulators and certification laboratories to accelerate validation, detect regressions earlier and benchmark devices under consistent real-world conditions.
One of viSer Neo's key differentiators is its ability to correlate radio-layer measurements, device performance metrics and application Quality of Experience within a single automated test campaign, providing engineers with deeper insight into the root causes of performance variations.
All charts, dashboards and benchmark visualisations presented in this report were generated using SmartViser's Viser Web Services (VWS) Analytics Studio.
VWS Analytics Studio provides an intuitive web-based analytics platform that transforms the rich dataset collected by viSer Neo into interactive dashboards, detailed KPI visualisations, and comprehensive benchmark reports. Engineers can explore hundreds of network, device and application metrics, compare multiple devices or software versions, identify trends over time, and rapidly investigate performance anomalies.
By combining automated testing with powerful analytics, SmartViser delivers a complete end-to-end solution—from test execution through to actionable insights—helping organisations make informed decisions based on objective, repeatable measurements.
Get the latest news from SmartViser.

Susie Siouti is the Chief Commercial Officer for SmartViser helping organisations in the Telecommunications industry offer superior end-user quality of experience and service with the introduction of innovative test automation products. Susie has 20 years of experience in the Telecoms industry and in that time has led teams across the world mainly in Testing and Compliance. Holding an MBA from Henley Business School brings a diverse set of skills and expertise, including business acumen, strategic thinking, financial management, sales and marketing expertise, leadership, and innovation.
Susie joined SmartViser in 2016, is part of the internal steering committee, responsible for developing and implementing the company's commercial strategy and encouraging a customer-centric culture. The main mission is to help organizations to create value by offering better quality products and services by improving operational efficiency and innovation.

Fantastic technical benchmark article! It’s refreshing to see real‑world, repeatable automated test results rather than just marketing‑focused feature lists. The side‑by‑side KPIs covering network, multimedia, gaming and battery give readers clear visibility into what Android 17 actually delivers under real‑live‑network conditions. This makes essential reading for mobile engineers and enthusiasts alike. Great work! --bike bros